

Pre-processing Technologies
DEM Generation
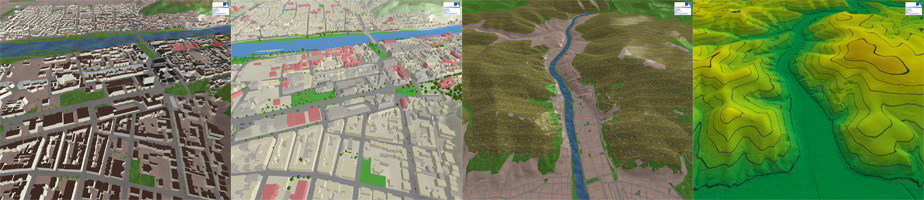
The basis for all virtual landscapes is the Digital Elevation Model (DEM). Heidelberg lies at the border of two distinctive morphological units: the upper Rhine rift (Oberrheingraben) and the mountains of the Odenwald. In order to capture all morphological features as best as possible and to store the surface geometry efficiently, we use Triangulated Irregular Networks (TIN). The data source was kindly provided by the Land Surveying office of Heidelberg. The DEM was delivered as a 5 meters Grid covering the city area as well as the surrounding hills and planes. Our own triangulation implementation is derived from 3D surface reconstruction algorithms and creates far better results than the usual 2D Delaunay implementation. In addition to the xy sample coordinates on the plane it takes the surface curvature at each node into account. The measure for the curvature for one node is the integral absolute mean curvature, i.e. a value composed of the lengths of and angles at the adjacent edges. Minimizing the integral curvature of the complete TIN renders a very smooth surface with relevant morphological features clearly recognizable.
2D Layer Integration
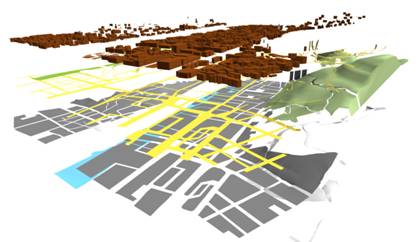 |
Resulting geometries after the 2D layer integration process |
The usual approach to add more information to the naked DEM and to make it more realistic, is to add aerial imagery, i.e. orthophotos as textures. This looks great for virtual globes and small scales. However, at close-up and in combination with a city model, odd effects become apparent like high rise buildings lying across the street and distortions due to the perspective nature of the images. In a GIS context it is desirable to include also available 2D layers of manifold topics that comprise e.g. land cover, administrative areas, infrastructure, geology, climate, pollution etc. In order to achieve this integration we cut the 2D layers into the DEM triangulation. This approach is geometrical. It does not alter the shape of the surface but divides the TIN into several parts that are connected to the land use (layer). To each part colour resp. material information is assigned that is retrieved from a layer style document. This way, we can reuse all the already existing data sets and can control the appearance by self defined styles that define not only the colour but also material properties and textures.
Level-Of-Detail (LOD) Generation
Since the aforementioned original 5 m DEM is less capable to be used for all scales due to the huge memory consumption and rendering requirement, we must implement a smart Level of Detail (LOD) mechanism that selects adequate resolutions according to the viewpoint position. The basis for the LOD generation is a mesh simplification algorithm, which removes elements of the original TIN that have a low visual significance until a certain error value has been reached. More precisely, we implemented an edge contraction algorithm following the principles of Garland and Heckbert (1997), which is normally used for reducing large 3D models captured by laser scanning. The result of this procedure is a collection of quadratic surface tiles of different accuracy and size that can be put together in order to build a complete DEM. In our case, the DEM contains additional spatial information since 2D layers have been integrated. The borders between these layers are treated with a penalty factor so that they remain recognizable.
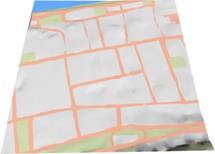
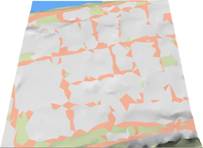
right: simple edge contraction algorithm.
Garland, M., and Heckbert, P. 1997. Surface simplification using quadric error metrics. Computer Graphics (SIGGRAPH '97) Proceedings, pp. 209-216.
Components and Features of the Spatial Data Infrastructure
(Geo-)Spatial Data Infrastructure 3D (SDI-3D / GDI-3D)
The main goal of this project is to establish a SDI-3D for the city of Heidelberg and to find best practices for data exchange, data preparation, service chaining, and user interaction. All server components are fully OCG compliant. The OGC (Open Geospatial Consortium) is the most important standardization organisation for geospatial technologies. We implement the most recent OGC services that are currently under discussion, along with the established and successful services for web mapping. We also investigate extensions to the existing specification in order to allow for special requirements of 3D data exchange and display.
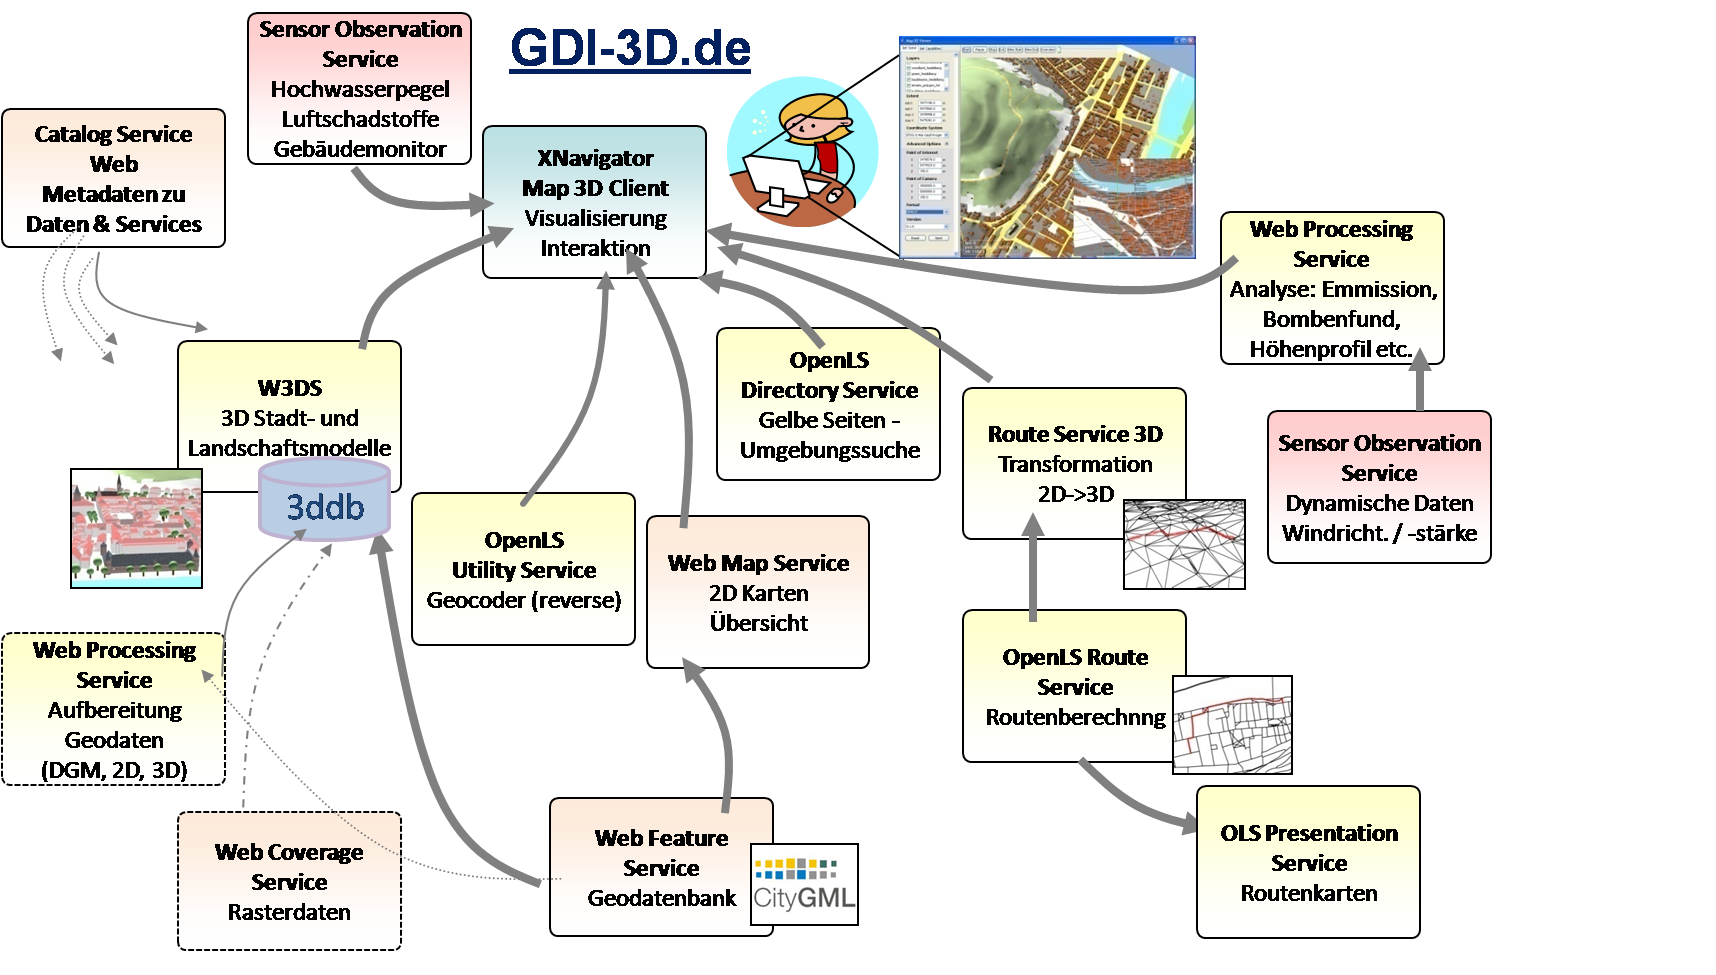
Web 3D Service (W3DS)
As a core component of our spatial data infrastructure, the Web3DService (W3DS) delivers the actual 3D city and landscape models compliant to the OGC W3DS specification (proposed to the OGC). Our W3DS is one of the first implementations. Within this project it is mainly used by our Web Client for retrieving 3D data. However, due to the standardized web interface, it can be as well accessed by other clients or components. The interface provides several parameters for controlling the results. The parameters are similar to those of the Web Terrain Service (WTS) or Web Perspective View Service (WPVS) (see OGC 3D Portrayal Service discussion paper: Hagedorn and Schilling 2009). The requested area is described as simple bounding box. Information on available layers and styles is provided by the server using the GetCapabilites request. The GetScene request delivers complete 3D scenes that can be displayed by standard web browsers or integrated in specialized client software. VRML 2.0 is supported as basic format, but also other formats can be used. Our W3DS implementation currently also supports Googles KML (Keyhole Markup Language). Optional parameters include a point of interest, a point of camera and a style for each layer based on the OGC Styled Layer Descriptor (SLD). The W3DS follows the concept of a medium server & medium client scheme, that is, the server is responsible for the data integration and transfers the display elements to the client, which is rendering the scene in real time.
3D Routing
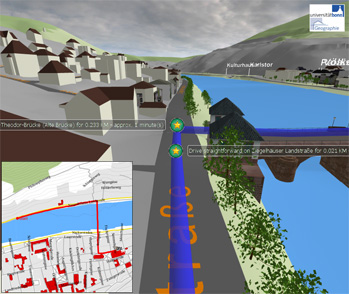 |
Route instructions in 3D. |
In order to avoid intersections with the terrain, additional points are added to the route segments. This enables an exact match of the route geometry with the DEM so that both can be superimposed. The resulting route geometry along with navigation instructions and control points is processed by the web client and presented as interactive animation sequence. An implementation of the OpenGIS Location Services (OpenLS) specification is used for routing, which is also applied at http://www.openrouteservice.org. T he calculated route geometry is converted into 3D using height information from the DEM.
3D Web Viewer (XNavigator)
The first web client and viewer for the W3DS was developed for desktop computers using J2SE, Java Webstart, Java3D, Java Topology Suite, Xbean, and other state of the art Java technologies. The main development requirements were hardware independency (J2SE and Java3D is available for Linux, Solaris and Windows, Mac will follow), best possible performance and dynamic loading and pre-fetching in order to avoid cumbersome user inputs. The latter is achieved by a block based streaming scheme, which downloads complete blocks (tiles) of specific LOD according to the current viewpoint position. The web client is already able to connect to a large set of OGC Web Services, e.g. W3DS, OpenLS Route Service and OpenLS Directory Service, WMS (Web Map Service), SOS (Sensor Observation Services), WPS (Web Processing Service), Catalogue Service Web (CS-W) etc.
3D Styled Layer Descriptor (3D-SLD)
A separation between geometry and visualization rule has become accepted in dynamic GIS applications, so that a geometry can be displayed in different ways according to the context. Thus, the maintenance of the geometry is cleared from redundancies and only the visualization rule needs to be replaced. With the development of 3D visualization rules, which are based on the current "OGC Styled Layer Descriptor/ Symbology Encoding (SLD)", this standard can be extended in order to support also 3D models in the future. For the Web 3D Service (W3DS) in this project we implemented a first subset of this comprehensive specification, e.g. for the visualization of terrain, buildings, and point geometries. The 3D-SLD is applied to geometries like points, lines, polygons, text, raster images, terrain surfaces, and bodies by a description of how they should be displayed. This description can include material properties, attribute or spatial filters, textures, fonts, transparency etc. As can be seen in the following figure, different layers like buildings and terrain can be described by different styles / SLDs separately. This way it is possible to colour buildings according to their usage (public, industrial, private). Furthermore an enhancement of the existing OGC Symbology Encoding from 2D to 3D has been developed and is being advanced to a specification by a working group of the OGC.
© 2010 University of Heidelberg, Department of Geography, GIScience